Finding competitive locations for your practice is equal parts art and science. Learn how Demographic Data, Competitive Research, and Procedural Data can impact your success. We offer several report types depending on where you are in the process of locating and securing real estate for your practice.

Invest wisely in growth using Research and Data Solutions from Practice Real Estate Group
Finding the perfect location for your medical and dental practice starts with knowing the market. Before you jump into a property tour, you’ll first want a report of medical or dental statistics in your area. Oftentimes, this data is compiled into what’s commonly known as a Demographics Analysis Report. This report will include:
- Area Income Demographics
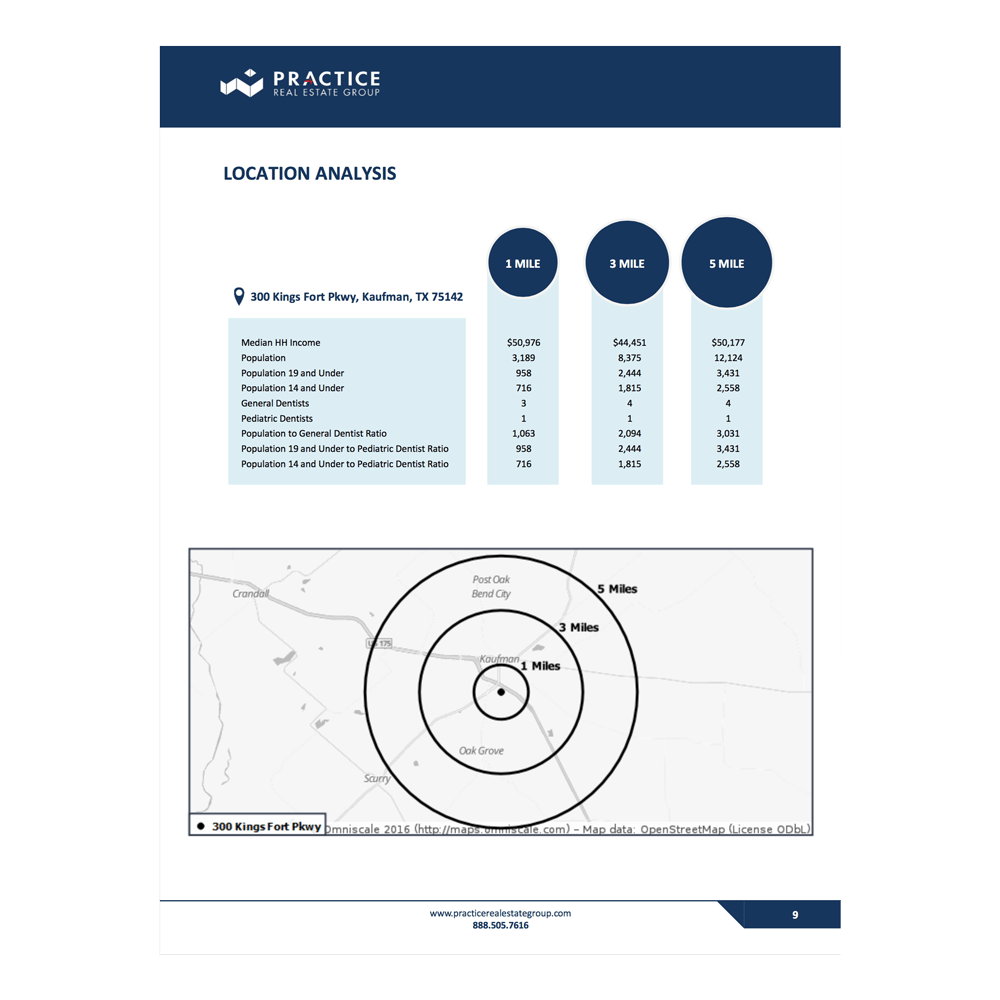
- Location Analysis
- Area Population Demographics
- Competition Analysis
- Traffic Count Maps, and
- Dentist to Population Ratio by Zip Code
This data can also help with marketing efforts, as you will want to target the exact population you want to serve instead of everyone in town. Using Area Income Demographics, you can select recipients for direct mail campaigns or craft a targeted marketing mix of newspaper and radio advertisements. Using Area Income Data, you can market your message where your ideal clients are likely to see it, whether it’s on a billboard or in the senior living section of a newspaper.
Site selection is just the ‘tip of the iceberg’ when it comes to a demographics report. Any marketing company you hire or marketing strategy you craft in-house will lean on demographics to determine who to market to and how to market to them. Once you’ve determined who your audience is, you can decide which media platforms to use – direct mail, email marketing, or billboards. Finally, by knowing your client base through in-depth demographics data, you can test different messaging that resonates with them.
In summary, there are uses far beyond site selection for the demographics report. Demographics reports can also be used to guide your marketing efforts once you open practice.
Area Population Demographics
Area Population Demographics simply show the number of people living within a particular area. The analysis of this information is highly significant. The existing population and expected population growth of an area can impact its potential as a location for a dental clinic. Furthermore, you’ll need to know if your site can sustain another doctor.
As with each section in a demographics report, you’ll want to keep all of the data in mind before making a decision. For example, while expected population growth is a factor (and generally a good sign), it’s not the biggest factor. If an area is already underserved but not showing growth, it may still be a good option.
Conversely, if an area boasts a large population but the ratios are still low, then it’s likely not a strong choice.
Corporate dental offices may open in saturated areas because of the strength of their brand. Smaller start-ups need to find areas with growth and a current population to sustain the office.

Competition Analysis
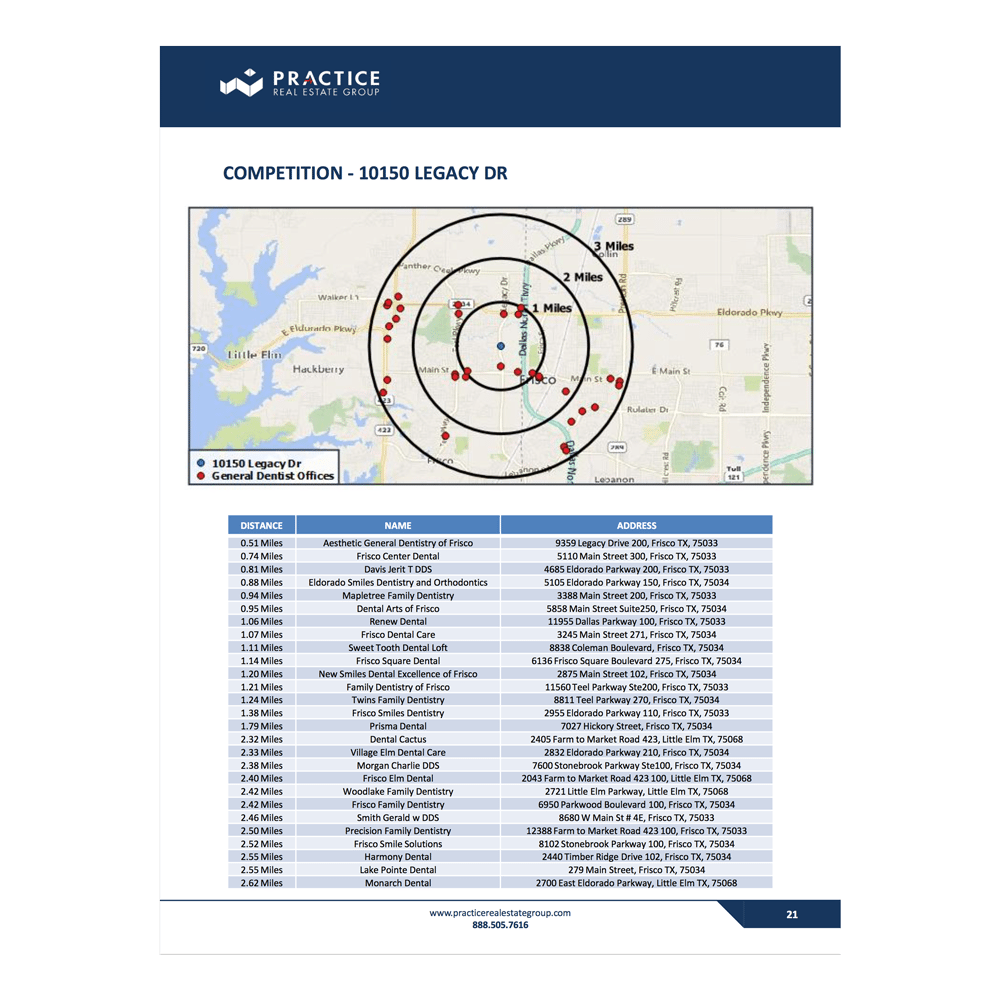
A Competition Analysis maps one, three, and five-mile radii, but this time shows where similar practices are located in relation to a site of interest. Dots on this map will distinguish types of practices that may compete with yours. In addition, the section lists the exact practices that correspond to those dots on the map with their business names, addresses, and distance from the site.
How do you choose the perfect mix of affordable and visible?
Not every type of doctor needs high visibility. A specialist who wants to focus on surgeries or implants doesn’t require as much visibility, because their customers typically come from referrals. However, signage is the number one referral for general dentists, whose customers come from word of mouth and insurance networks.

 Area income demographics are an indicator of what kind of market you’re entering. For example, if you’re hoping to serve Medicaid clients, you’ll want to seek out lower-income areas than if you specialize in cosmetic dentistry or plastic surgery. (You can find more about who qualifies for Medicaid